I’ve completed a deployment of remote telemetry monitoring of depth gauges with TU CA. The purpose has been to visualize the depth readings for several Trout Unlimited CA gauges.
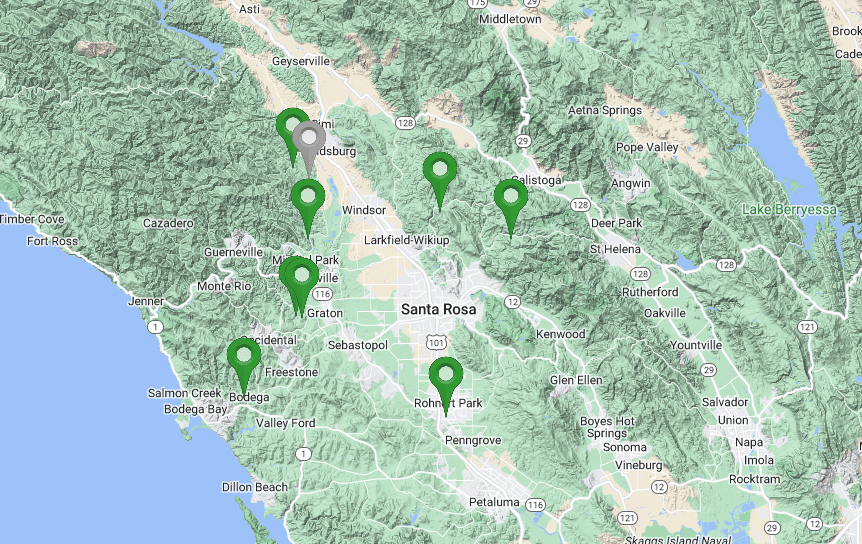
To access monitormywatershed.org/browse/ and select “Trout Unlimited California”
Each sites purpose is to monitor the levels of the streams, that are then translated by TU field hydrologists to flow readings.
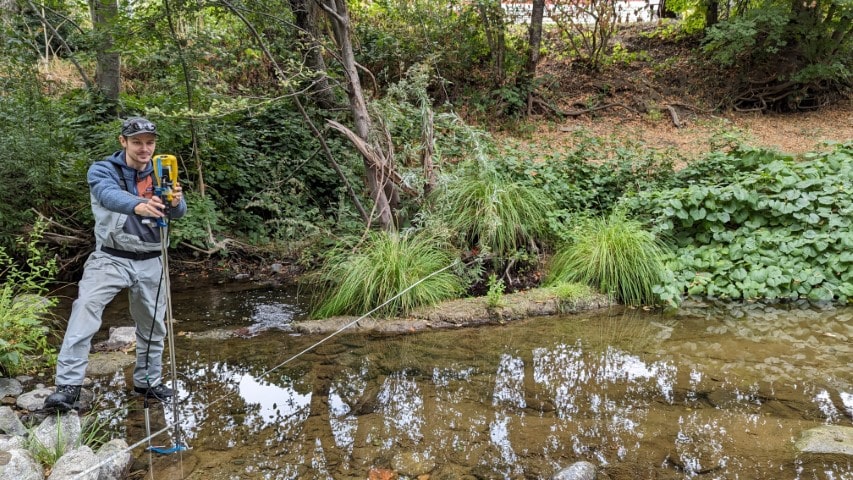
This projected added telemetry for the water depth to be visible on MonitorMyWatershed.
I would like to thanks the SWRC for having this community and sponsoring the discussion on how to automate physical water quality terrestrial measurements and have them easily visualizable via telemetry on the internet at monitormywatershed.org.
It takes a team with a variety of technical skills to make this work. In particular I would like to thank, Sara D, Shannon H, for being on the front line of logging and telemetry of data from the riparian zone. Personally, its fantastic to have the “how to monitoring station manual”, with instruments interfaces (ModularSensors/sensors), running on an integrated low power computer platform (Mayfly) that can be deployed in the field, and wirelessly transmit “telemetry” the data to “the cloud”. Thanks also to Beth F for the tutorials to get started with ModularSensors.
MonitorMyWatershed.org time-series (a graph) visualization is fantastic for its easy access, good graphics, and long-term storage. Thanks to Anthony A, and his team including Paul T, for the curating the cloud presence. I’m sure there are many more people who also are enablers of this – like Scott E and web site guru Heather B. (I’m only using first names as I haven’t asked permission to use peoples names – if anybody wants me to remove references or use their full names please let me know)
As a retrospective, this is the third series of deployments that I’ve done for local non-profit organizations. The first was relatively simple with my own instrument design, older telemetry hardware and using TinyOS . The second deployment used hobolink.com for visualization, a Hobo U30 telemetry enabled logger with 20mA interfaces, to take readings from two low cost pressure sensors – usually Keller devices.
For Coastal Redwoods, a critical measurement is low water flow in the long hot dry summer. Surface water can start varying 10C between day and night time temperatures. Its critical to have the level measured accurately to +/-0.01’ with this temperature fluctuation. This places a lot of thermal stress on the resistive pressure measurement – and its challenging for the instrument to eliminate the effects of this temperature change. This is usually part of the “Total Error” including a temperature range in the instruments specification. TU California instrument of choice is the Insitu LT500 – which has excellent thermal specification, and rugged cable. It is also a complete logger – meaning time-series readings can be downloaded from it via “Boot-net” – walking up to it and offloading it. The LT500 has interfaces for 20mA, RS485, SDI-12.
I selected the RS485 and it also requires 12V. I designed a wing board for the interfaces github.com/EnviroDIY/Mayfly-Modbus-Wing/tree/master/knh002-MayflyWingShield.
For this telemetry deployment, largely enabled by the new generation of Cellular LTE CAT-M1 devices. The sites mostly use LTE CAT-M1 Verizon, but one needed switching to ATT and one site is over WiFi through a local landowners gateway.
It’s required some radical honesty and hard testing work for these sites to function reliably in a way that I could support, and also, I believe can scale to larger deployments. Earlier this year the cloud team came through with solving throughput issues on MonitorMyWatershed.org ~ thankyou so much.
I have forked and enhanced the core ModularSensors – and this can be found at https://github.com/neilh10/ModularSensors/wiki/1a-Feature-notes
For anybody wishing to do remote monitoring of a single LT500 – they can easily take the same path I’ve created, with no software experience required. I’ve created a modular system with the software as one component. The parts are
a) RS485 board with +12V, (I haven’t tried it on the new enviroDIY board with local +12V)
b) Mayfly1.1+uSD+battery (at least 4AHr)+ solar panel (at least2W), and outdoor enclosure.
c) Modem + appropriate antenna – Digi LTE CAT-M1 XB3 or Digi WiFi S6 -selectable in a ms_cfg.ini
c) Download the compiled software and program (with avrDude) the mayfly<release>.hex to the Mayfly 1.1, register a new site on MonitorMyWatershed.org, download the UUIDs to a ms_cfg.ini file and load it onto the uSD.
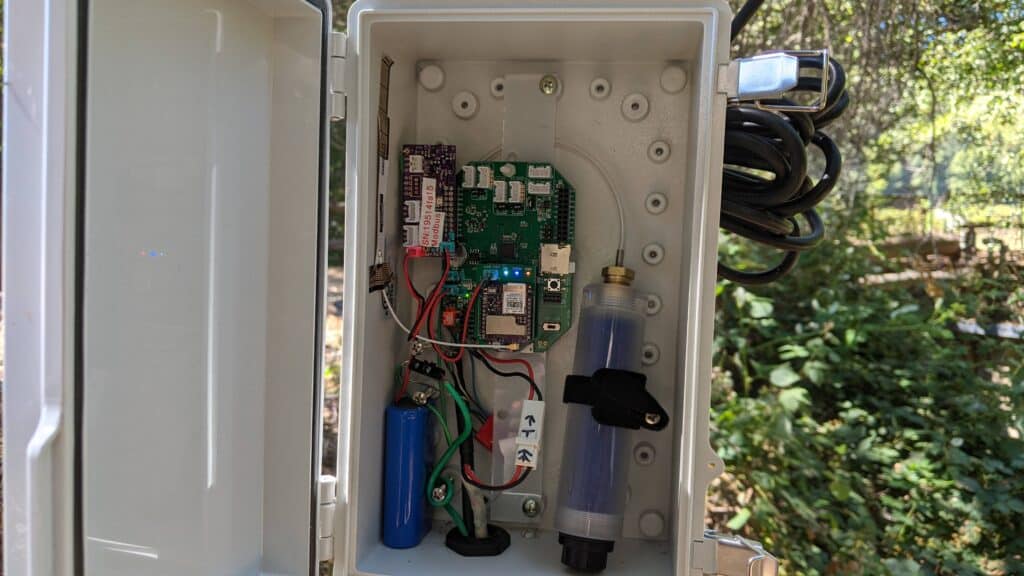
My sites using an enclosure “Bud-PTR-11050” look like this
Of course some sites by streams are complex
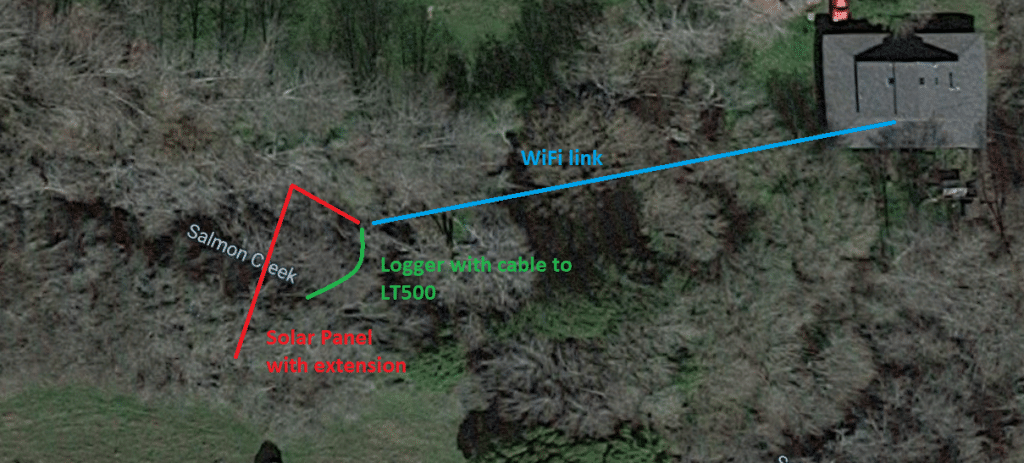
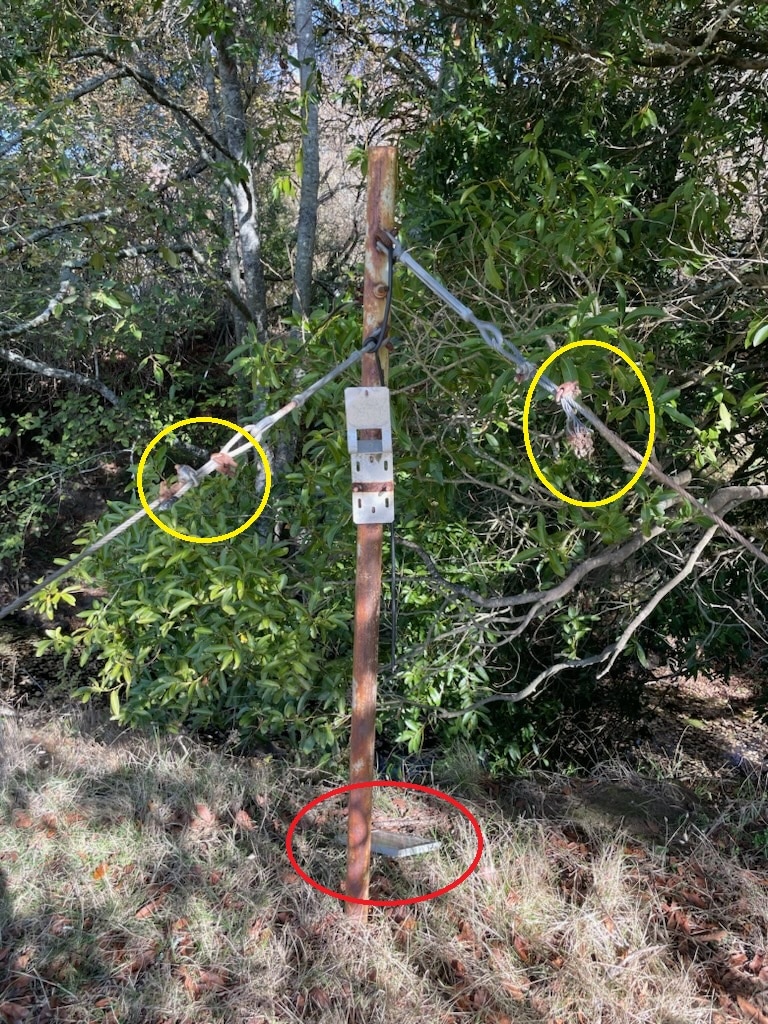
At this site, some cows initially appreciated the solar panel as a rubbing post. Early on we found the solar panel on ground (red circle), and hairs on wires (yellow circle).
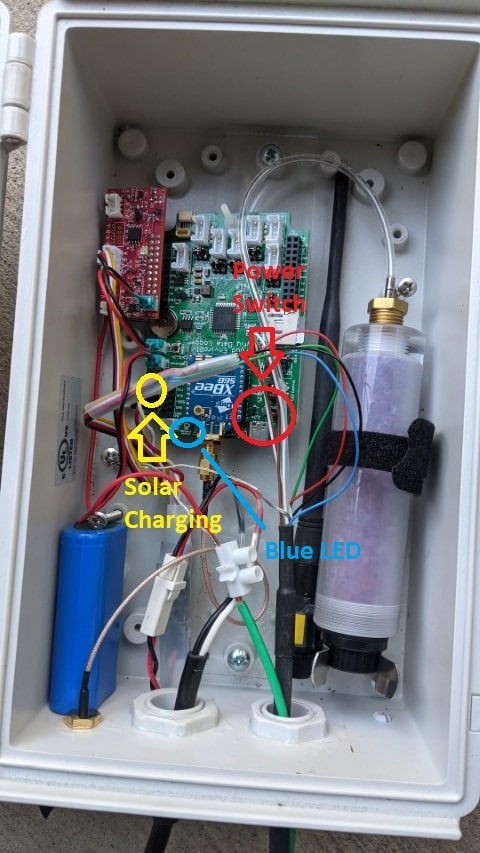
Instruction for checking solar need to be simple
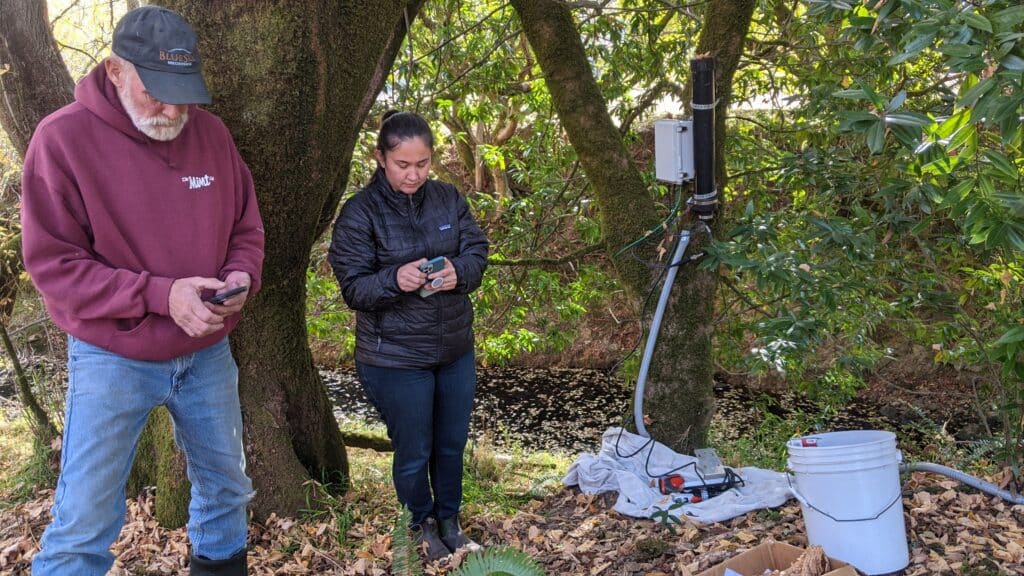
In the end – checking to see if its online
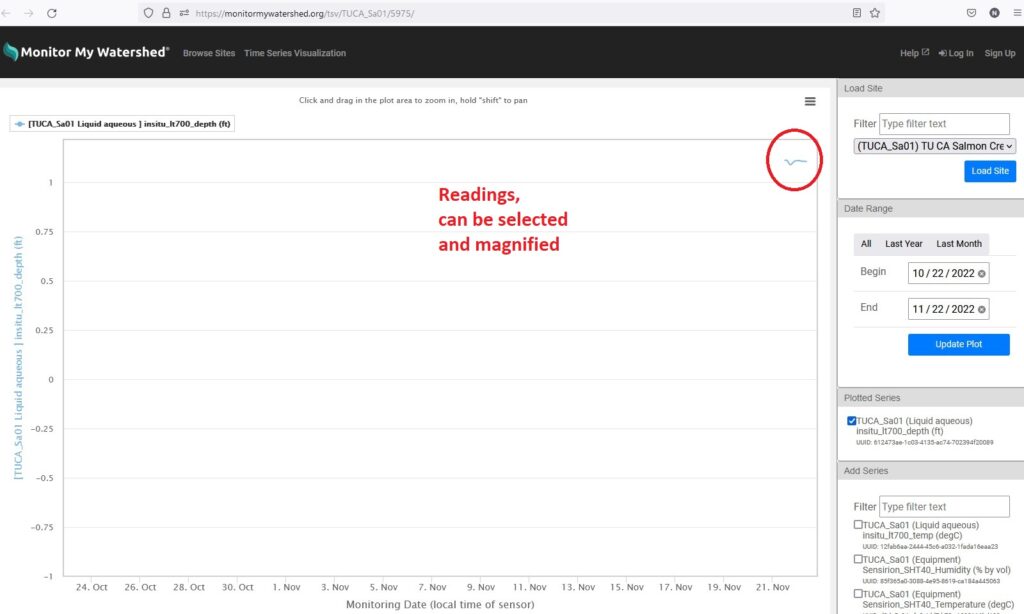
And then the “users” given some hints on navigating the graphs.
On link to monitormywatershed.org/sites/TUCA_Sa01/, on Water depth – click the TSV icon
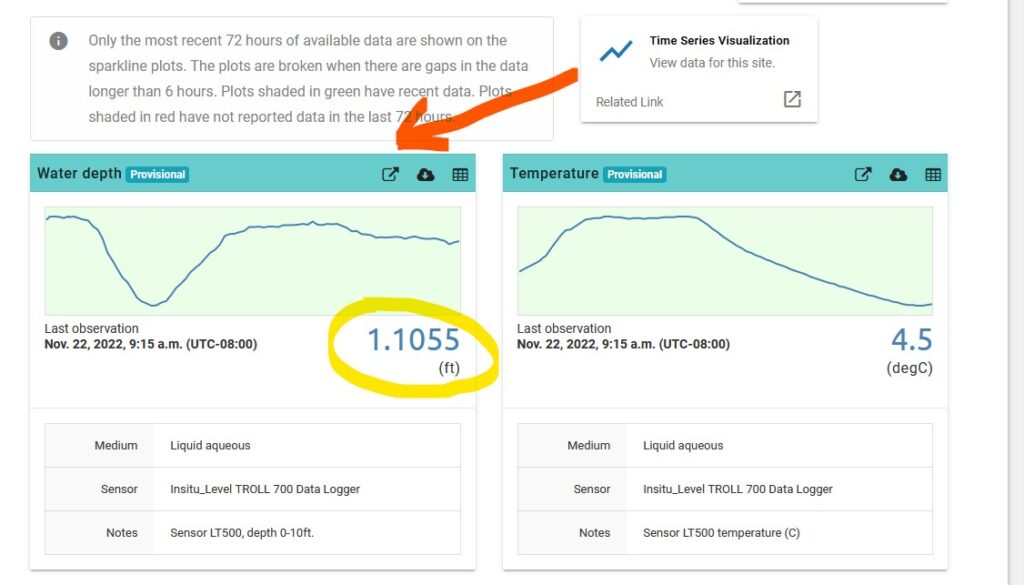
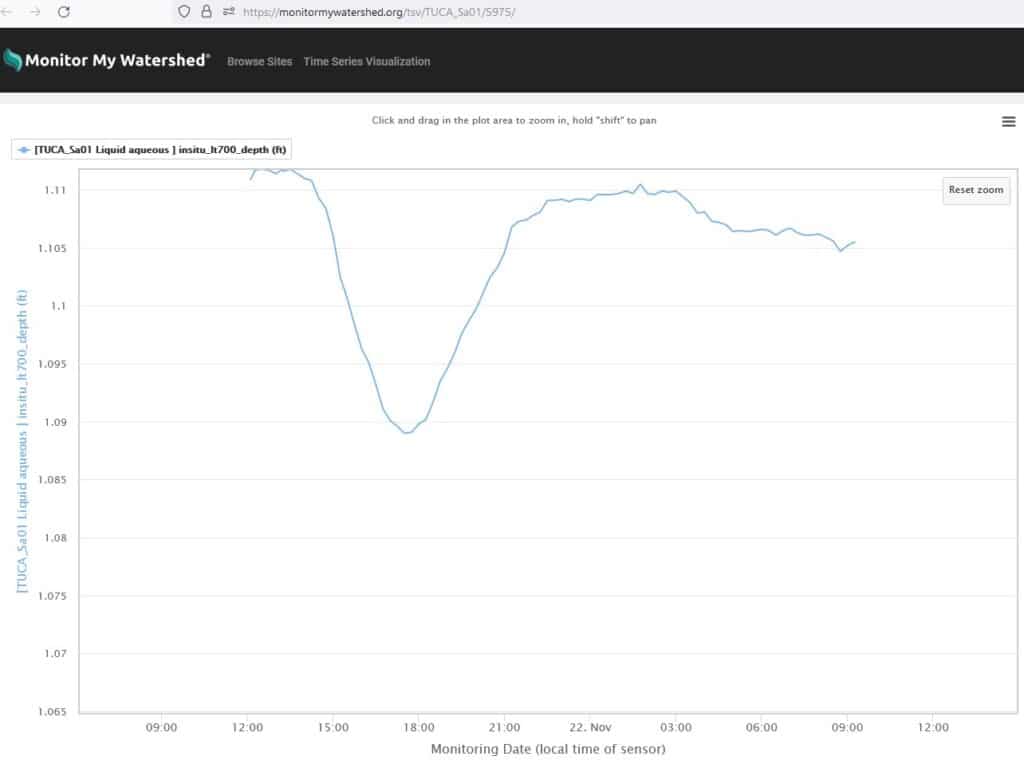
Then using the mouse select visual scope, to amplify

I’m happy to start a discussion/share details on assembling a system with the LT500 if anyone wants to.
The next article in this series – https://www.envirodiy.org/n-ca-mayflys-through-the-winter-storms/
Neil Hancock envirodiy.org/members/neilh20/

 Welcome to EnviroDIY, a community for do-it-yourself environmental science and monitoring. EnviroDIY is part of
Thanks so much, Neil, for taking the time to write this. I’m sure it will be helpful to a lot of folks!