To recap from a previous blog, I’m testing equipment to measure water depth accurately in low flow applications in surface water streams. This is often challenging as the sensors are typically pressure-based 5psi (0-11.5′ of water), and subject to swings in environmental temperature. A recent acceptance test of some Level Troll 500’s (LT5) showed the variability in each sensor and this is compared against Keller NanoLevel(KNL).
The LT5 is a deploy-able submersible transducer, it uses a protected vented piezo resistive sensor , in a narrow long detachable (0.72″x 8.5″) mechanical body that is designed to fit down a 1″ access hole, in a well head. The LT5 is very well engineered, stand-alone, and the software WinSitu has a lot of power for navigating the data and producing graphs. The LT5’s were purchased as part of a project.
The KNL is a submersible transducer component, it uses a vented robust ceramic capacitive sensor, in a wide shorter (1.5″ x 2.5″) mechanical body supplied with cable, requires an external power supply, interfaces on 4-20mA or RS485, and my research indicates about 1/3 the price. The KNL’s were swapped out by Keller as replacement for an earlier project purchase of levelgages as being more compatible for surface water monitoring.
This discussion is about comparing the accuracy of the measured water level, with temperature variation, of the two transducers using different pressure sensors – LT5 piezo resistive and KNL ceramic capacitve.
Summary: a lot of sensors, including piezo resistive & ceramic capacitive pressure sensors vary their output based on their temperature. The sensor’s temperature dependence is often compensated for by the manufacturer as a cost option, as an integral part of the transducers specification.
A number of LT5’s/KNLs were tested to meet their stated total error band specification across factory calibrated pressure and temperature ranges ; that for a temperature variation of 0-50C, the perceived output would not vary more than 0.1% of the sensor’s full scale. For the 11.5’/5psi sensor this is +-/0.012′(feet) (+/-0.012′ == +/-0.14″ == +/-3.5mm). The potential error range for a surface water stream depth measurement can be significant if the temperature varies significantly, and is valuable meta signal to validate the reported water depth.
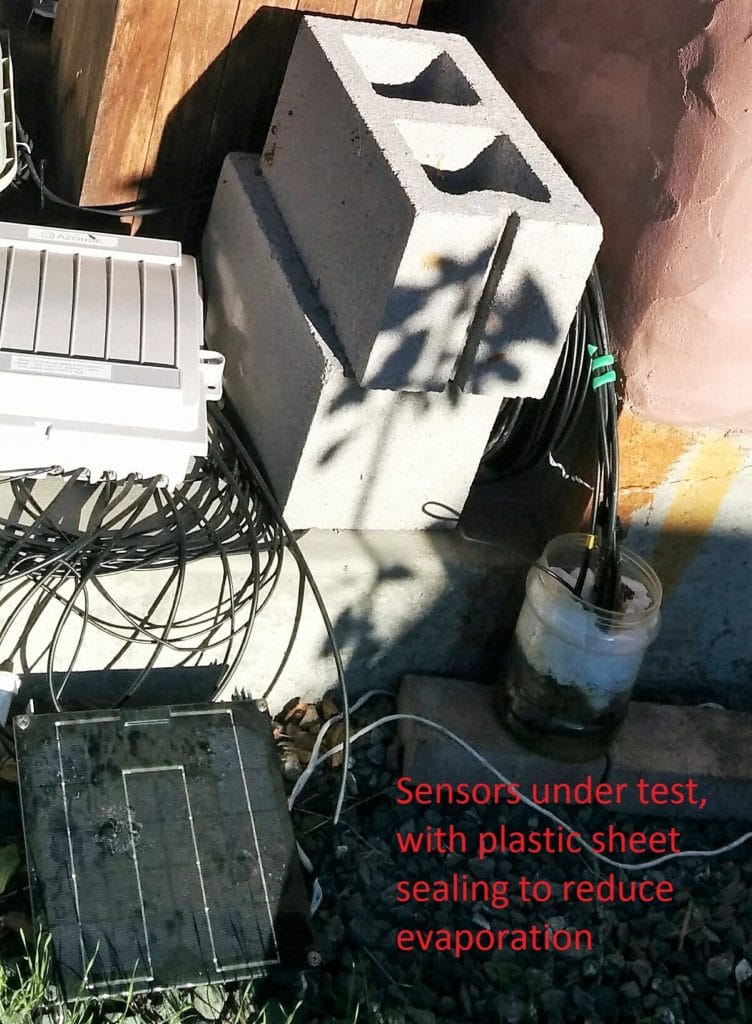
The test setup was two LT5s strapped together in one water jar and three KNL’s strapped together, placed outside on solid ground with a westerly aspect, and some plastic sealing to reduce evaporation. The wires are strapped to a post to prevent wind influence. The placement is away from any vibration or foot traffic. All transducers were setup to measure the water depth every 15minutes. The LT5’s have their own internal powering and logging, and for this application were also connected to an Onset U30. Of three KNL’s setup two were connected to an Onset U30, apply excitation power for 10seconds before measuring water depth and one connected to a custom RS485 setup with the power always on.
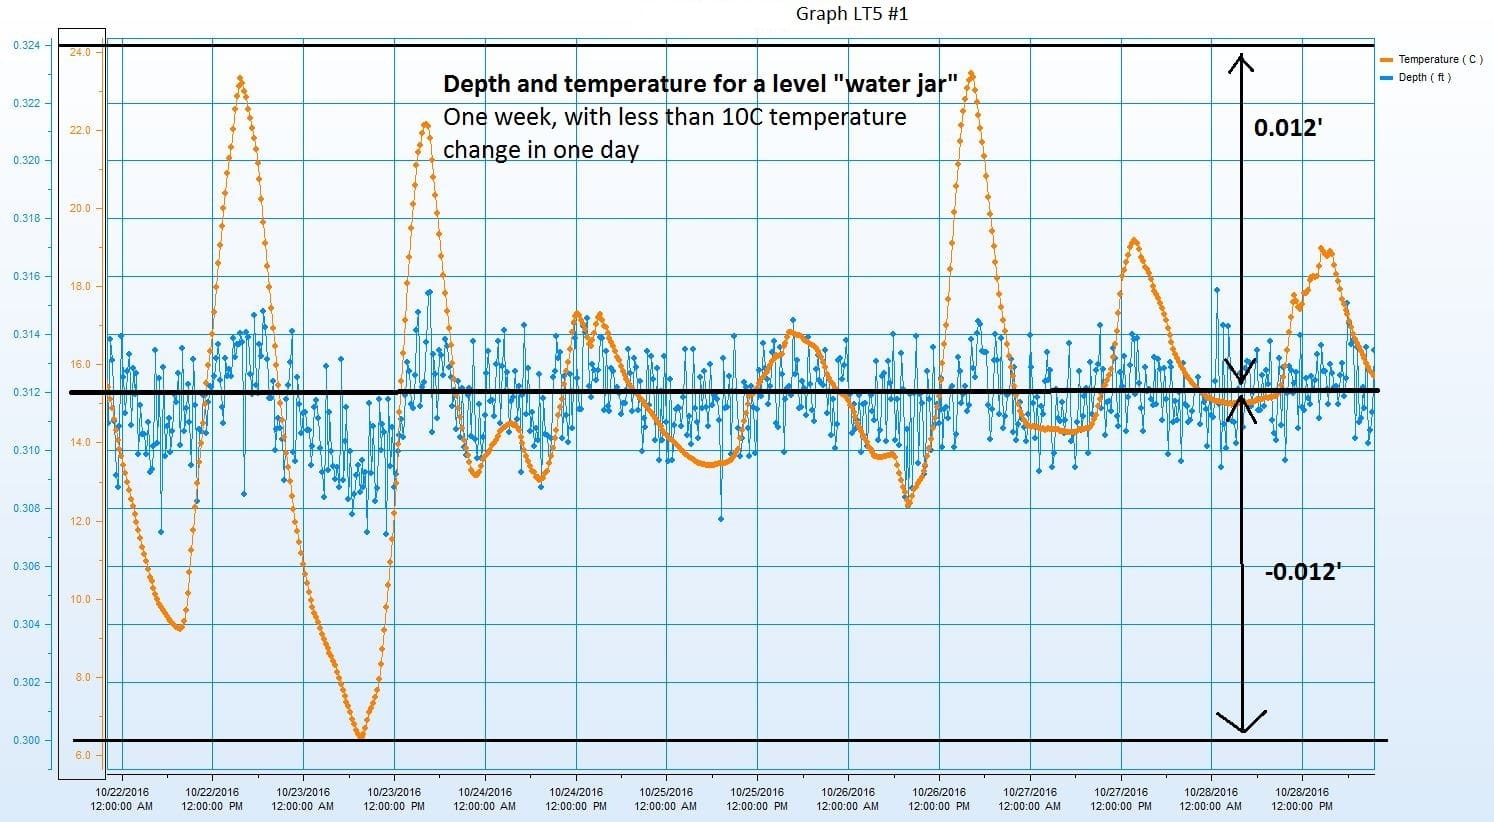
A snapshot of the two LT5 sensors over a week shows a few days with 4C daily variation (a cloudy day) between night and day. The amber is the temperature (C) and the blue line is water depth (feet) .
The thick black line in the center is drawn through all the measurements as an average and from that the “0.012” represents the potential sensor measurement error bars. With 2C daily change, there is barely any perceived change in water depth.
Looking closely at the first temperature peak, it shows a change from 10C to 23C to 6C – and the variation in readings is visible.
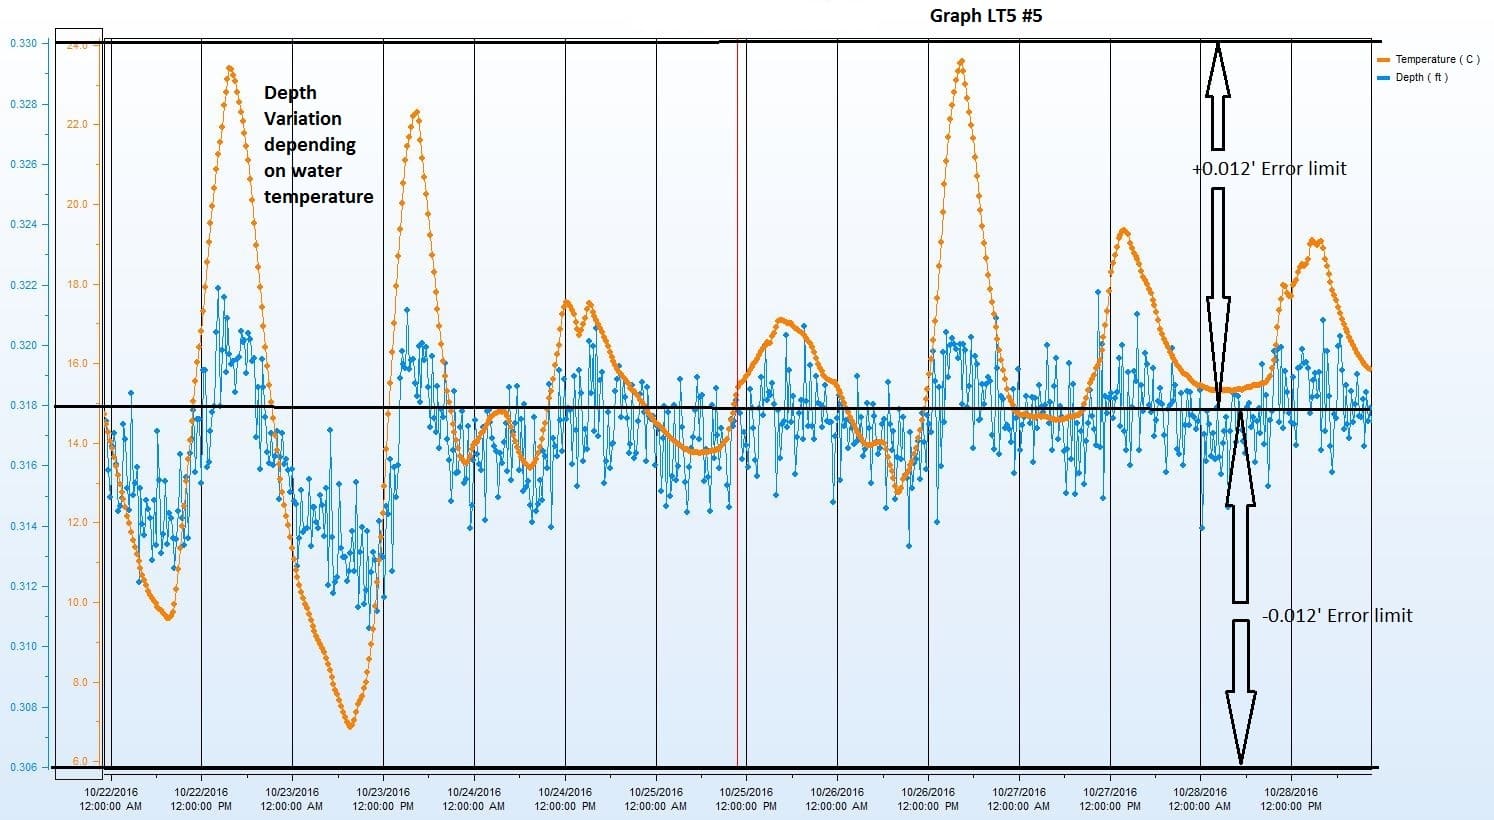
The partner sensor, #5 for this also shows temperature variability that is even more visible.
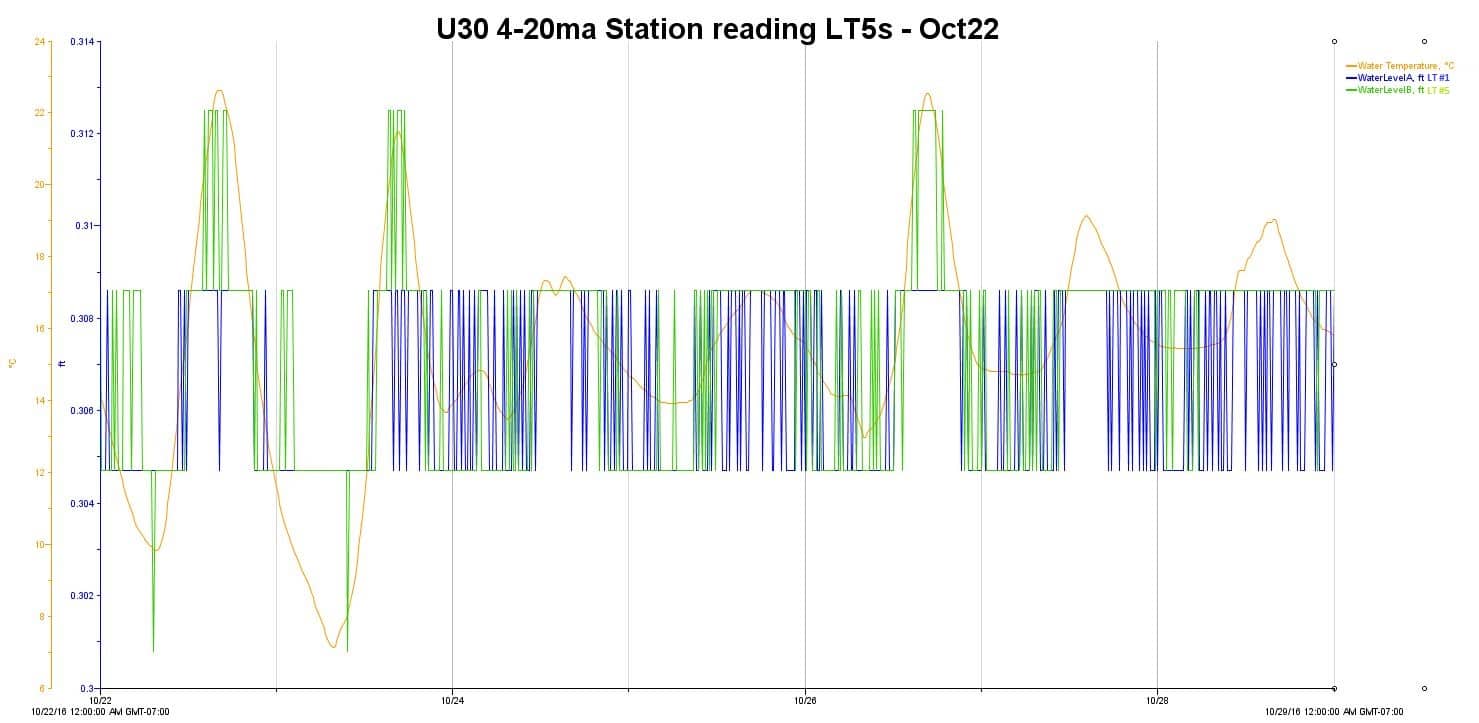
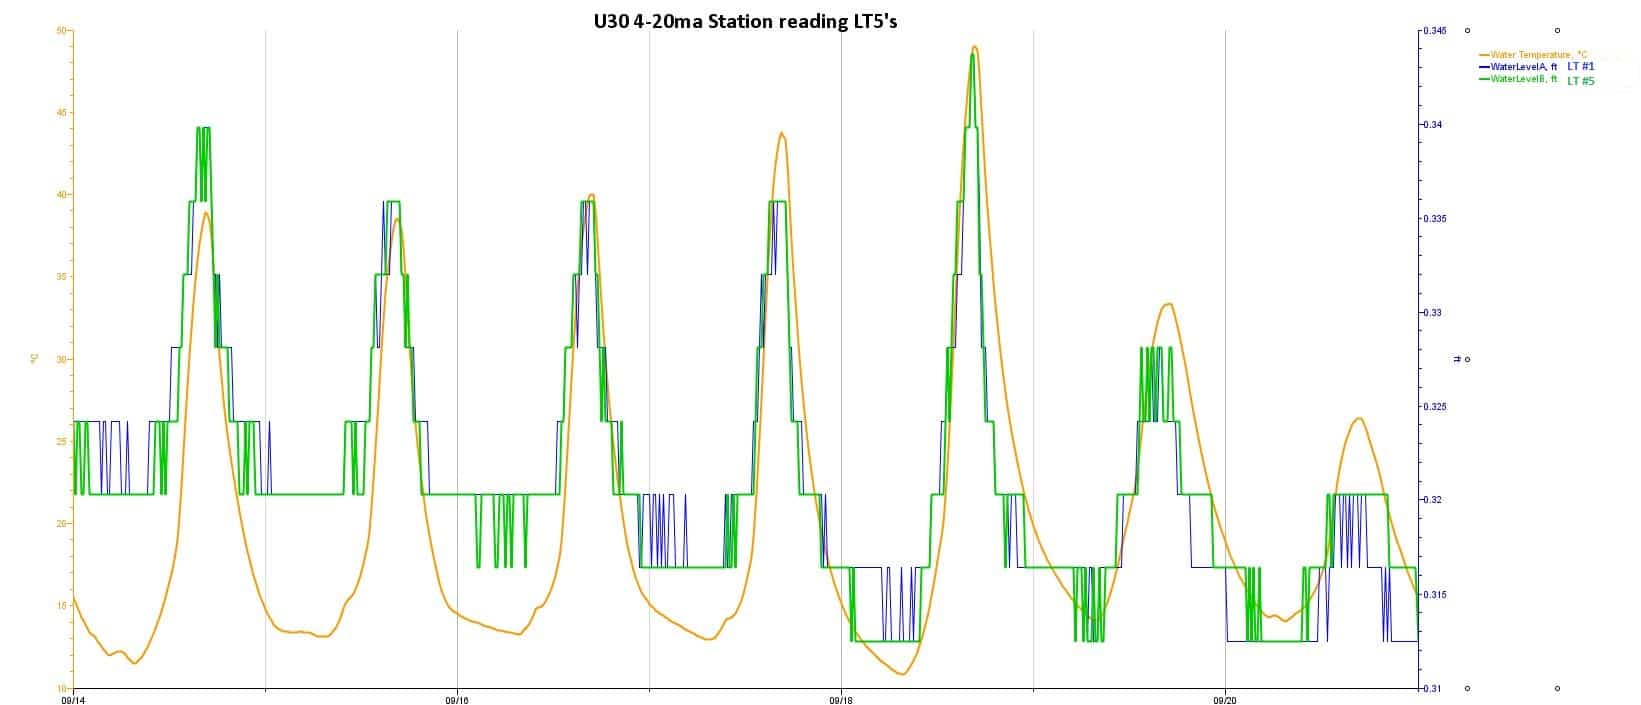
The two sensors above were also read by a logger U30 with wireless cellular capability. The depth readings are smoothed and what shows is the 12bit ADC resolution smoothing. Using the Onset Hobo ware software, I wasn’t able to figure out how to change the depth reading scaling to make it easily comparable to the previous graphs . The amber line is the temperature, blue line LT5 #1, green line LT5#5
The LT#5 sensor merits more inspection, and for an earlier hotter day the change due to temperature is even more apparent.
For the hottest day, a temperature shift from 11C to 50C is seen. The perceived measurement is challenging to interpret. The black lines represent offsets from the mean observed cooler temperature, and clearly the hotter readings are well outside the +0.012′ range. So instead applying an error mask across the full depth change, the sensor exceeds its stated range, and it’s not the full range from 0-50C, only 11C to 50C.
Other sensors in the group fitted within the error range and were between +/-0.010 +/-0.008′
The above two sensors measured through their 4-20mA by a U30 are shown in the next graph. The difference between the LT5’s when in hot water is smoothed somewhat by the 4-20mA conversion. The LT5-#5 (in green) shows a little wider variation. Also to note, even though this uses the 4-20mA standard to query the LT5’s, the 4-20mA conversion is not limiting the accuracy of the measurement, its the temperature compensation that can be the limiting factor .
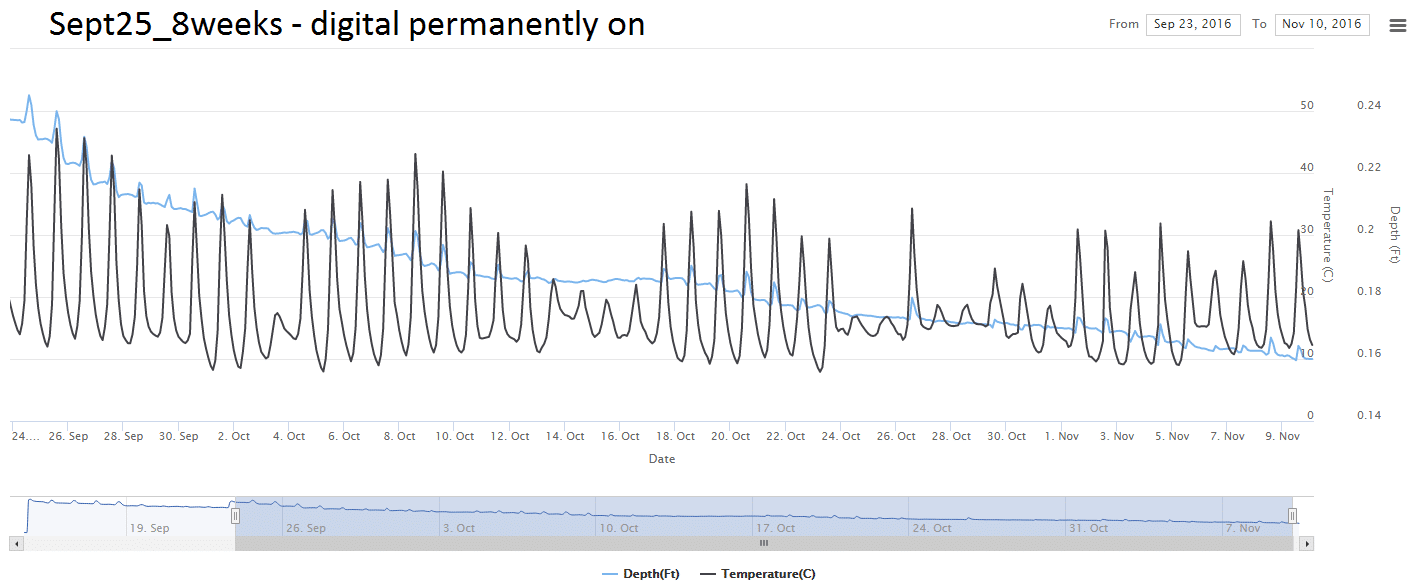
The single KNL, “KNL-RS485”, always on polled over RS485 had an excellent very small temperature dependency. For this graph, covering 6+weeks, the black is the daily temperature cycle, and the blue is the reported level of the water. The blue only shows minor changes once the temperature diurnal cycle exceeds 10C
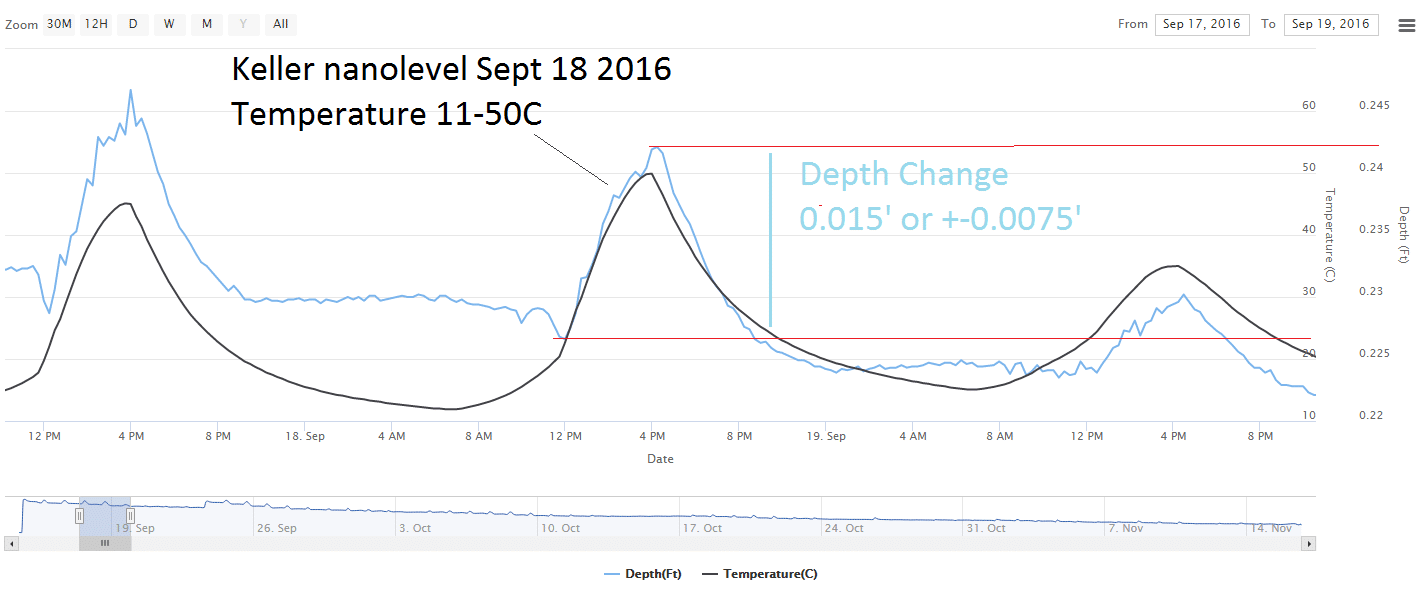
The graph below, shows one hot day, for a 40C (10-50C) temperature change, there is a 0.015′ foot change – the least amount of change seen so far.
These tests demonstrated a very low amount of noise between samples. However, its not a realistic comparison as the KNL-RS485 is always on externally powered, and the LT5s are being switched on. I hope to be able to repeat this test with a switched excitation voltage (12V) interface in the near future, and see if it still has the same stability when switched.
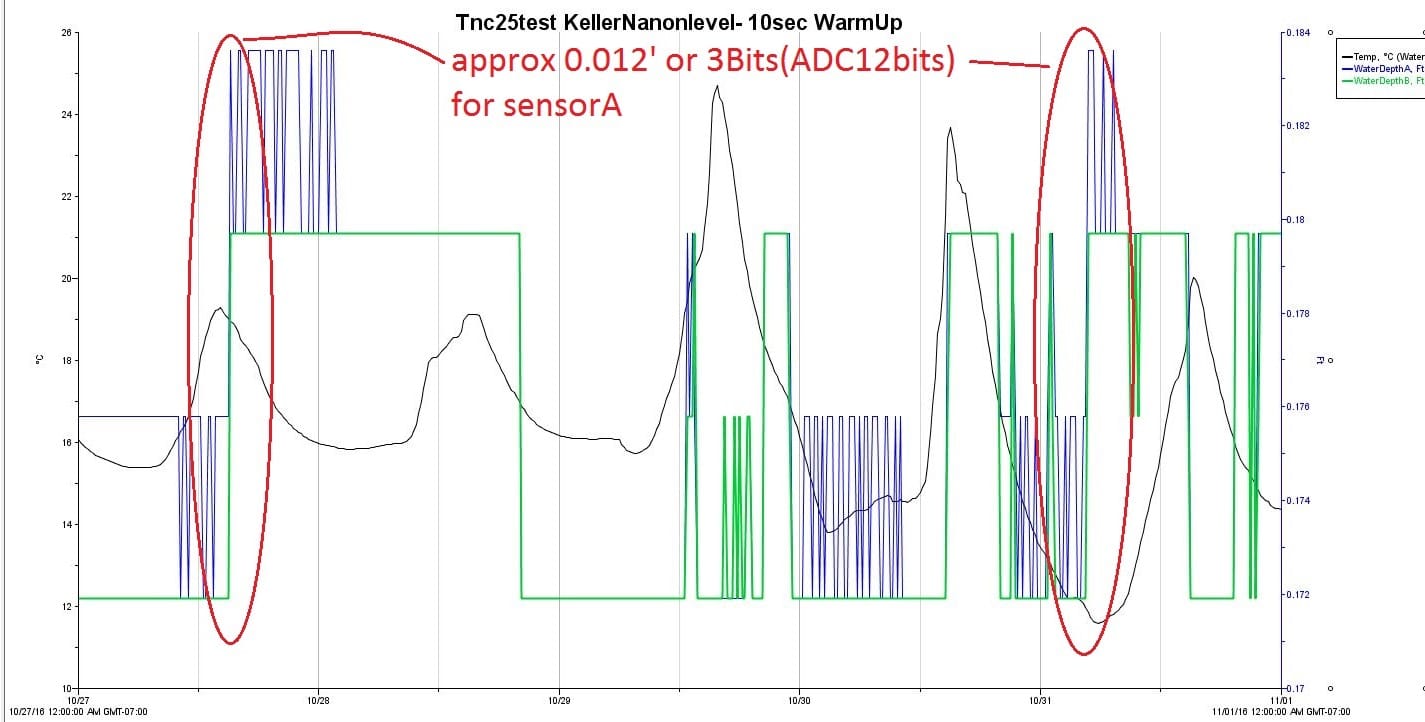
The dual U30-KNL’s on the other hand showed more noise with the U30 4-20mA even with small temperature changes of 4C. The U30 was set to provide an excitation of 10seconds (earlier useage had the level gage and acculevel set at 3seconds). In discussion with Keller support, I concluded that there wasn’t away of getting the same stability as seen with level gages and also with the KNL-RS485, and the noise floor at 2 or 3 ADC bits (12Bit ADC) for a stable water level, was too high. It technically still meets the manufactures total error band accuracy, but on the 4-20mA it can’t be derated for small temperature changes. For the KNL’s its a far better option to poll it over the RS485 keeping the power on all the time – in fact that is always the best option if available.
Conclusion: the LT500 is a very well designed slim mechanical instrument, vented for the best measurement sensitivity, has integrated logging with simple offloading, depth measurement and sensor temperature compensation. The temperature compensation of each transducer may need to be base lined if the diurnal temperature change is high. The LT5 depth readings sampling “noise level” – the way they bounce around each 15 minute period, is somewhat annoying, and a well understood characteristic for electronic equipment, but may be a result of having too much resolution in the readings, as well as inherent issues in small diameter piezo resistive sensor. The Keller Nano Level/4-20mA has a significant amount of noise. The one Keller Nano Level/RS485 transducer tested has a superior temperature compensation and stability when the power is kept on and polled over the digital interface.
Figuring out does the transducer meet the criteria that are critical to a specific project, is part of the real-world of measurement technologies.
Reference:
Keller Nano Level Spec Sheet.pdf
Reference on piezo resistive sensor search for “C. Pressure Sensors”

 Welcome to EnviroDIY, a community for do-it-yourself environmental science and monitoring. EnviroDIY is part of