To recap from a previous blog, a project looking at effects of drought conditions is monitoring the low water depths in-stream, with transducers that have a capability of reliably measuring changes of ±0.01’(feet) in low water conditions, connected via an open interface 4-20mA to an Onset U30 cellular wireless logger.
For reliability, it was decided to use two water transducers per logger.
Over evolving phases of the project, I acceptance tested a number of transducers, Keller Levelgage, Acculevel, Nanolevel, Insitu Level Troll 500 and a Chinese manufacturer. These transducers all work for a specific environment, however please read the whole project article before making conclusions about specific transducers.
Overall, the Keller levelgage transducers were disappointing for the number we initially returned to the factory, missing key parameters in the specification sheets and drift. Keller have supplied some replacement Nanolevel to try.
We are now deploying the Insitu Level Troll 500’s (LT500) that have a good overall design for the project with adequate temperature stability, and built in logger. However we haven’t had a lot of field time.
Big picture Summary
The target specifications is for measuring low water flow / depth in-stream accurately and capturing the approximate depth of seasonal peaks, with an open interface capable of transferring the measurements to the internet.
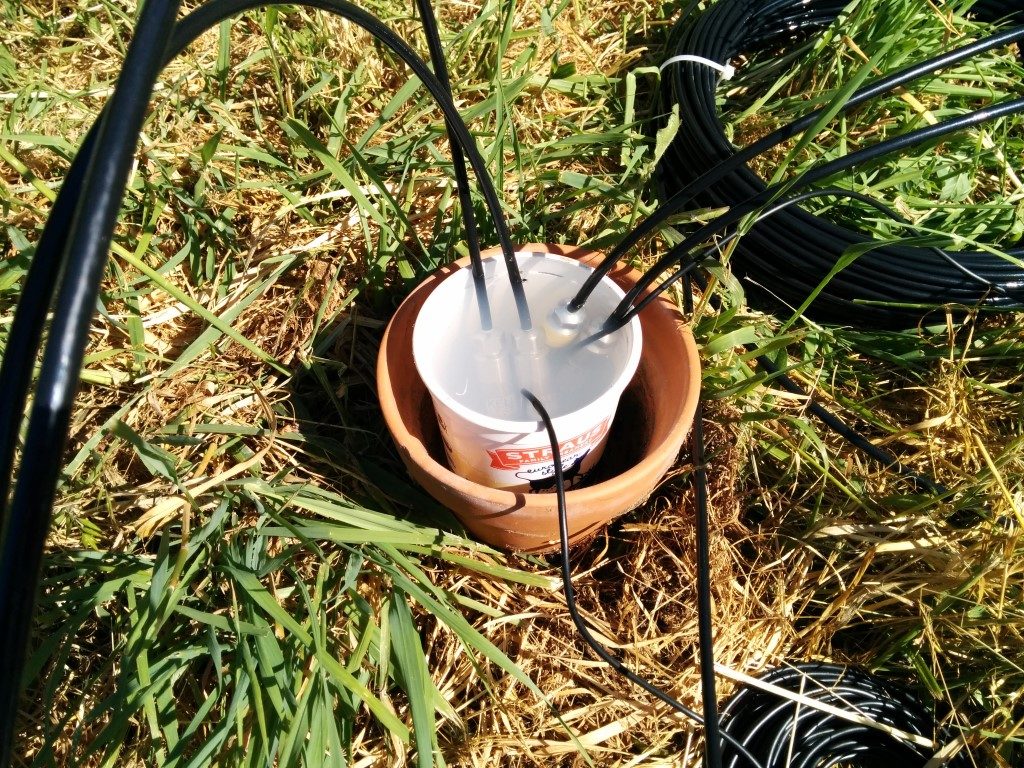
The transducers can be easily acceptance tested for measuring low water depths with a diurnal temperature change. This was the early testing setup with two sets of dual transducers and associated temperature monitors.
Detail Specifications
The requirement is to be able to monitor the low flows, gpm (gallons per minute) in streams that are tending to zero, on surface water flows. This is a major challenge! Part of the challenge is often the geographic situation as to whether or not the stream channel can be modified to facilitate low flow measurements – typically the stream channel can not be modified.
For any form of measurement, there needs to be traceability of measurements, and for low flows the first practical measurement is stream depth. Stream depth to flow rating curves are another discussion beyond this article.
For water depth measurement traceability, with a basic science physics training in pipetting techniques (visually looking at water depth against a known scale) its possible to have traceable change in water height measurement error in the order of ±1mm, which is ±0.046″(in) or ±3/64″, or in USGS units ±0.0033′ (feet).
For the electronic measurement, I hope to define the edges of some of the challenges of traceable measurements- so if anybody has some brilliant insights on how to overcome them please add a comment.
Practicable and historical measurement accuracy for water depth has been specified at ±0.01’ (feet) or ± 0.12″ or ~±1/8″ or ±3.1mm. (Gee !!**%%). For stream measurement equipment the dynamic range of the sensor needs to be specified – and here again for surface water streams traditional range of 0-10′ has been used.
Historically, for low flow measurement, electronic equipment has used pressure sensors to convert the weight of a water column to a resistive measurement, which can be further converted to a digital value.
A 0-5psi (pounds per square inch) pressure sensor can measure 0-11.5′ of water height. These sensors are an engineering challenge, delicate and sensitive to temperature. Because the real world has varying diurnal (24hrs) temperate cycles, its also required to look at all transducers temperature coefficients. I use “pressure sensor” to mean the physical device that translates the water column height to an electronically measure value, and transducer as the whole device that provides a calibrated output on a defined interface.
So the requirement is to measure water depth of 0-10′, with temperature errors of less than ±0.01’ for a 10C shift change in daily water temperature, using a 4-20mA/RS485 with 50-100′ of line.
A ±0.01’ of 10.0′, is 0.1% of Full Scale, and in digital terms is equivalent to a 10bit accuracy – ie 1/1024. Practically speaking of course the digitization quantization needs to be far better than 10bits, at least 4 times or 12Bits.
As this is a pressure based transducer, its dependent on balancing the atmospheric pressure above the water column, across both sides of the sensor – that is its vented. Absolute pressure sensors – with reference to vacuum – introduce another level of error due to the roiling 10miles of atmosphere above the sensor.
To provide a sense of the influences on a pressure measurement, the atmospheric pressure at sea level is defined as 1 Atmosphere (or 1.013Bar or 101.3kPa) , which translates to 14.70psi which is about 33′ of water depth. We are all living under the equivalent pressure of 33′ of water – and we have evolved to use it, and not notice it.
Practically speaking, there are a variety of units of pressure measurement, water depth, and temperature, so I hope you can translate from your favorite measurement type and forgive my somewhat arbitrary choices of units of measurement.
There are a variety of methods for measuring water depth at a relative low cost – not mentioned in this article – and if anybody has a technical method that can better the accuracy/cost at low depths (0.5′ of water), be great if you share it in the comments.
The measurements in graphs
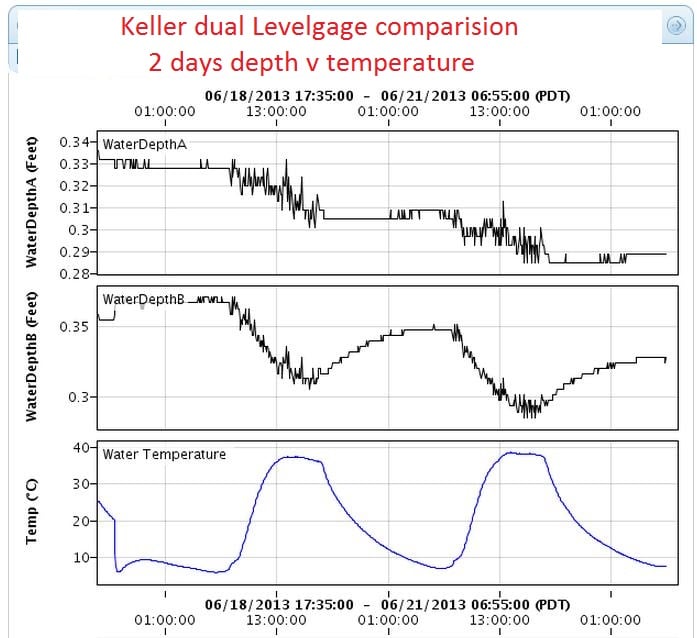
For the following transducers, with a temperature shift of 30C the WaterDepth A & B sensors are stable with no temperature change. Once the temperature changes, there is an acceptable change for WaterDepthA and a much larger change for WaterDepthB. However the shift of 30C is three times larger than needed so both transducers are passed and deployed in the field. In practise the transducers were tested for longer than two days – but this a snapshot of 2days:
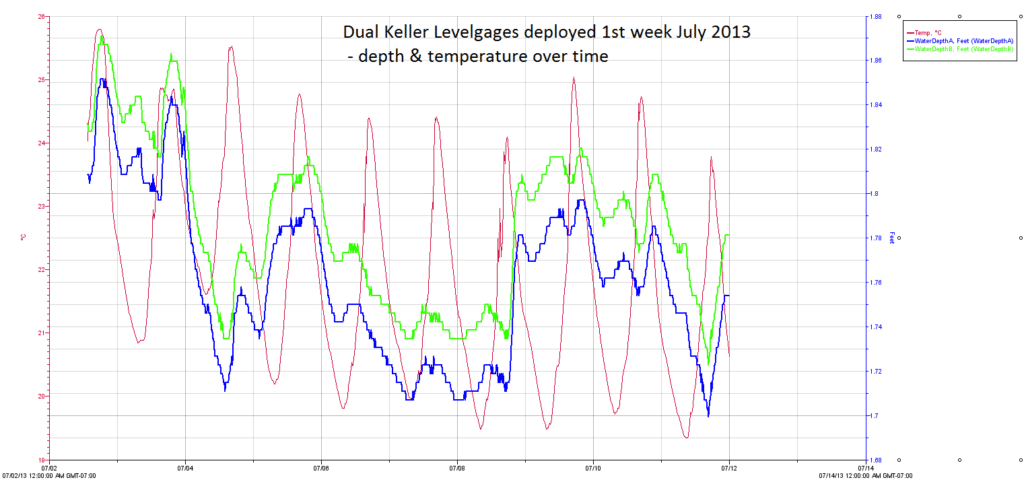
Deployed in July 2013, the real world temperature shift is usually less than 6C, and both transducers temperature dependence looks to be within +-0.01′
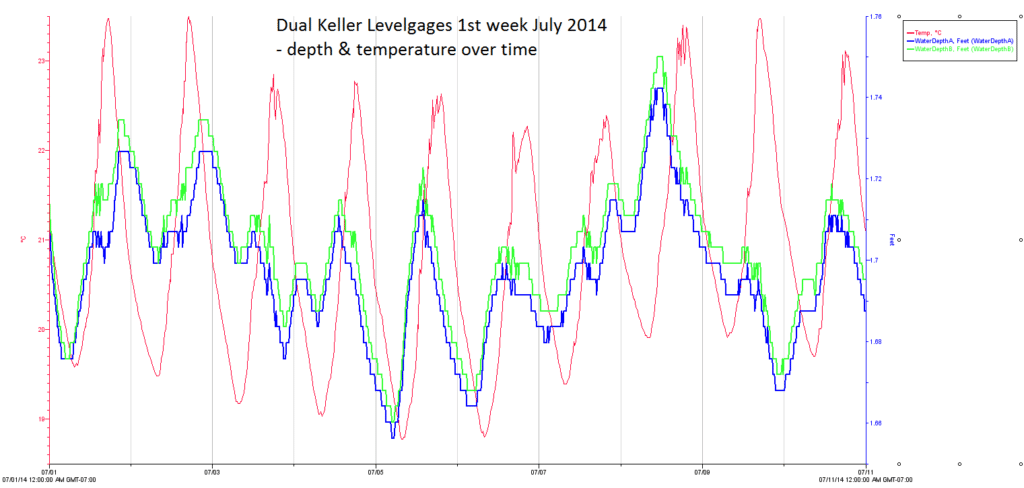
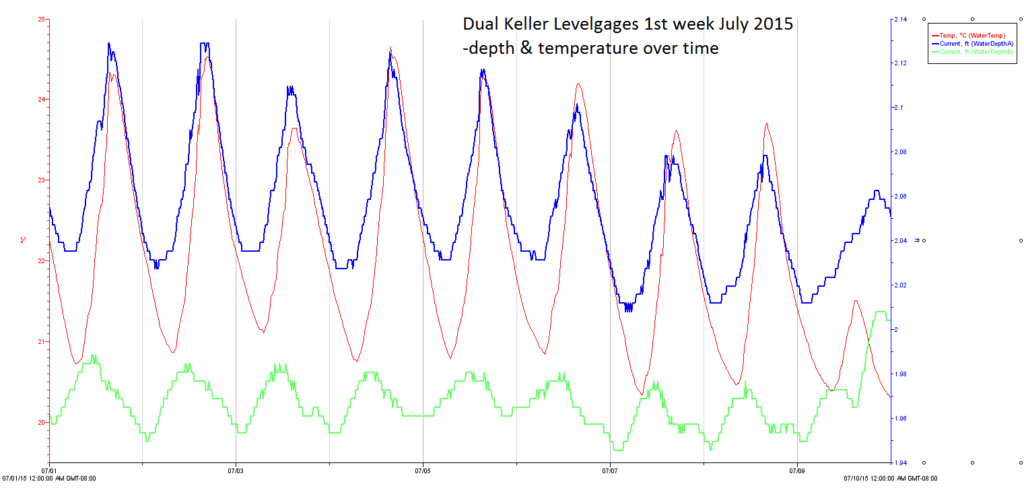
During the 2nd year, after peak flows, the measurement in 1.7′ of water and 4C of temperature change both sensors are following each other, and showing some interesting daily variations. In addition the air temperature & humidity are monitored, and in a riparian setting vegetation sucks up water and has evapotranspiration. The reported change of depth of the transducers isn’t always visually related to the temperature curve.
During the 3rd year, the two transducers have become visibly different, with the WaterDepthA reporting a lot more change +-0.03′ – it does appear to be visually aligned with the temperature change. WaterdepthB is showing a daily change that is approximately +-0.01′ but not always aligned with the temperature curve
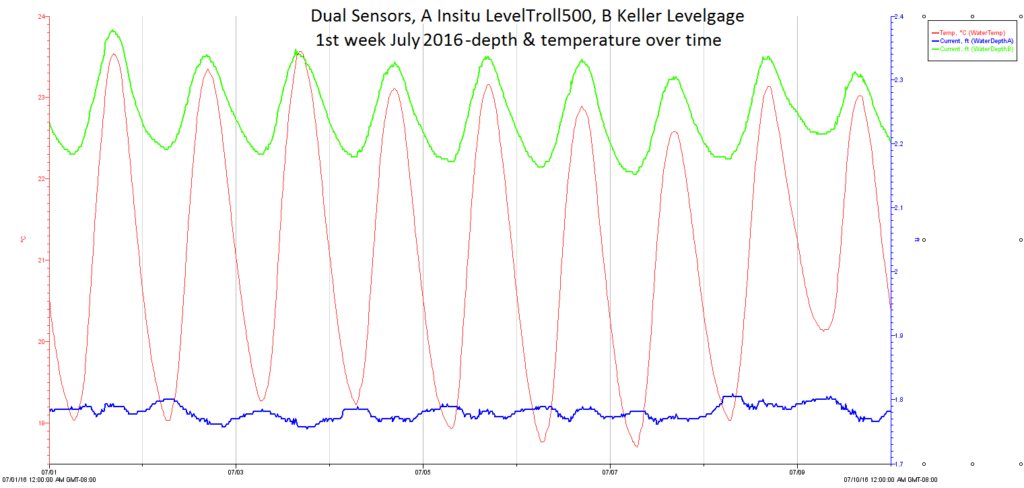
The Keller Levelgage WaterDepthA has been replaced by an Insitu Leveltroll 500. The difference in height beween A and B is due to installation changes – the water was too deep to be able to make it level with the existing Levelgage as there were some good rains earlier in the year and the water is still higher than previous years. WaterDepthA is showing more relistic daily changes. WaterdepthB is now showing a daily change that is approximately +-0.05′ that appears to be aligned with the temperature curve
In the next blog, I’ll go over in more detail the acceptance testing results from the other transducers tested.
Let me know if you’ve found this data useful, and what other data may be useful. Next>

 Welcome to EnviroDIY, a community for do-it-yourself environmental science and monitoring. EnviroDIY is part of