@neilh20
5 days agoForum Replies Created
-
AuthorPosts
-
Good to hear. and definitely very interested in use with a flume. What range of water depth measurement are you looking for and depth accuracy of measurement.
Typically, because ADCs are got good around 0.0V and rail – the Sensor range from 0.0 to full range, the Voltage range is from 10%Rail to 90%Rail (eg 0.3V to 3.0V for 3.3VDC rail) and typically wants to be ratiometric. That is the ADC voltage VREF is the same as that used by the sensor. The other way of adjusting that is that the measuring device has a greater range than the actual range of measurement. That is 0.0 is less than the flume entrance.
Resistance varies with temperature (as everything in the universe varies with temperature)- so they haven’t listed what the temperature dependency is. It might not be much in the water, and may need a reasonable shield for that out the water.
How are you looking to power it, Are you looking to report it wirelessly? Standard ModularSensors is best effort in both cases.
Hi Eric – I’ve purchased and looked at using the eTape.
I was just wondering what made you think they are “calibrated” – that is the “0.0” markings relates to a defined voltage. Usually this is shown for a calibrated sensor. Similarly for a Full Scale relates to a known Voltage.?
looking at the graphs, they describe “0-5VDC Linear Resistance to Voltage Module PN-05V00199 REV 2” but no graphs of 0.0 to V
Be interested if you find that they have it calibrated .
Hello Elliot, gosh too bad for the experience. Its a core issue of how to ensure there is enough power, and then also recover from low power events. However to be able to get some help its best to post the details of the two systems. Need to phrase the problem with enough detail that some one else might be able to comment. Battery size and source, Solar panel wattage and source, Mayfly version and software. I would also suggest the graph of when it was operating well and then when it was drooping. Also of course the aspect of the solar panel. The 5V Solar Panels don’t do very well in shade.
Hi Jake, no “pressure sensor” is going to be able to be linear/accurate if ice is forming and expanding in the protective enclosure round the pressure sensor. My guess is the whole sensor would have to be specially designed to allow for the ice expansion to even survive a freezing event.
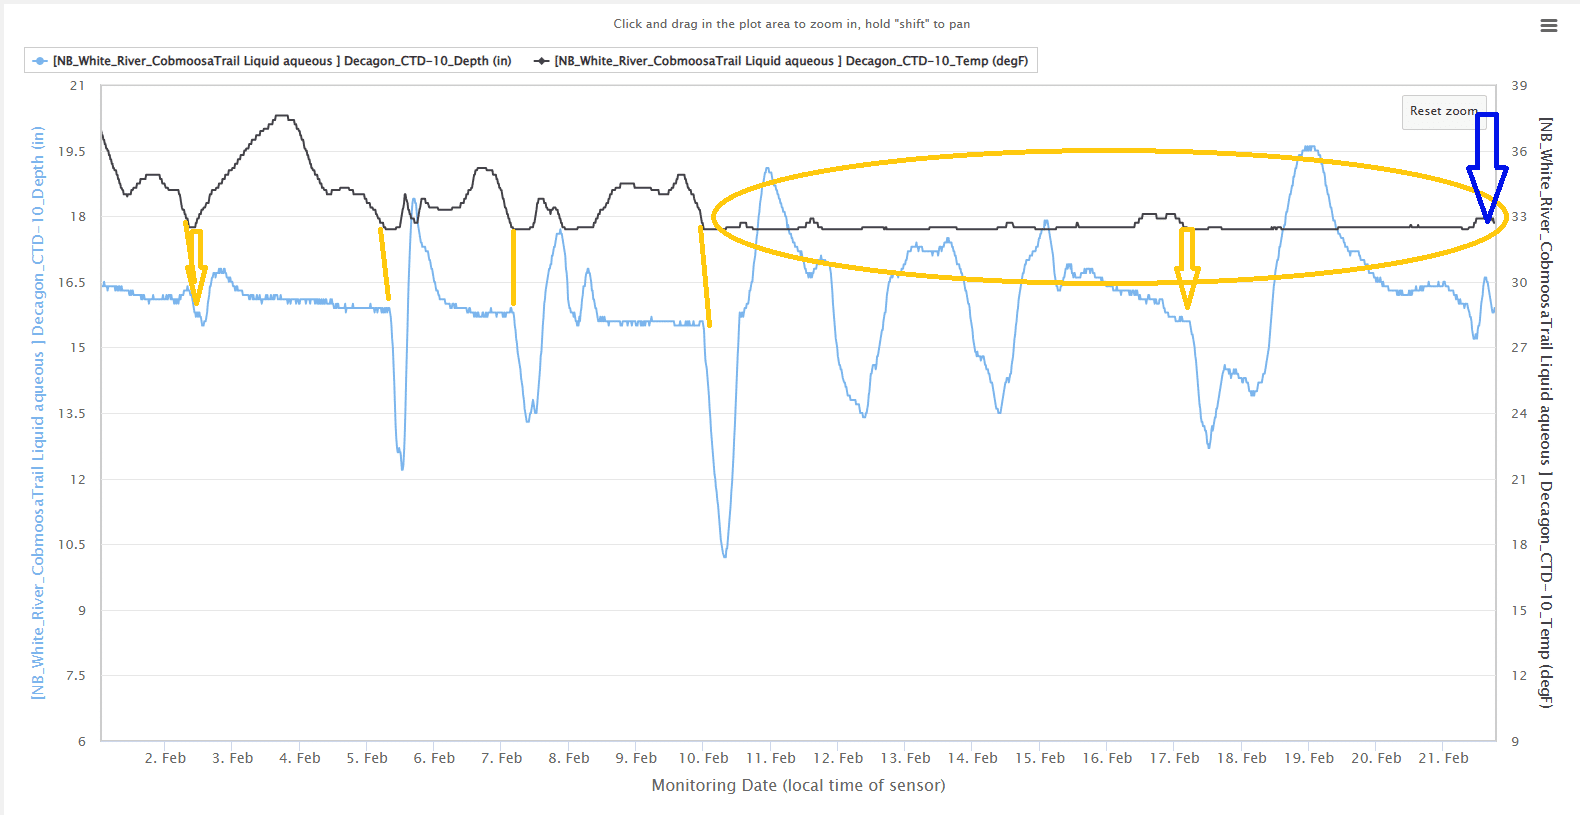
My hypothesis (guess) would be that its the nearly freezing is causing an artifact in depth reading. What is intriguing for that depth of water is that there are temperature variations of 4F between 3~5Feb. So unless you could observe the location and validate that there are real depth changes, its the sensor that is generating anomalous readings.
Then from the 10-21feb when the temperature line seems to flatten just at what looks like ~ 32.5?F Either the temperature sensor is failing, or you would be expecting ice to be forming on the surface. As its stream water – and ice formation is complex at round freezing seems
See annotated graph
Attachments:
I wonder what the water temperature is, or if there are water temperature changes, when this is happening.
From the graph it reads the water level is at 20″ depth then on the 10th Feb it drops by up to 5″ for some time (hours?) before recovering, with 3 other similar but not us pronounced events
IF any for of ice could build up in a pressure sensor it could change the readings, however at a water depth of 20″ that seems unlikely. As we know water is at its most dense at 4C, and ice forming at ~0C floats. It could be due to the hydrology that the water swirls and causes temperature fluctuations on the sensor – that’s why it would be interesting to have a reference to the sites, or have the temperature graph.
If there is a layer of ice, which you indicate there isn’t, and the water drops underneath the ice, the pressure on the sensor would change, which would indicate a real depth change.
Any temperature changes maybe key to artifacts in water depth readings – https://www.envirodiy.org/topic/artifactual-troughs-and-flickers-in-recorded-stream-depth/
@d_manning just wondering if you have had any insights

.
As you say from 2nd sept – something changed, after that it looks to me like its is triggered by the temperature changes. Its just a visual analysis, but also using the conductivity. With a rain event the conductivity also typically changes, and of course temperature can change.
For daily diurnal cycle after sept 2 the temperature starts varying by about 3C a day. before that it was about 2C a day.
The Metros_hyrdos21 Gen2 specification says “NOTE: Depth measurement accuracy assumes no abrupt temperature variations” .
All depth sensors/piezo resistive sensors have a temperature co-efficient, and typically have some form of temperature compensation to correct for changing temperature. For some reason something changed Sept 2 – you might have to forward the info to Metros and see if they can make any suggestions

Attachments:
2024-10-10 at 10:54 PM in reply to: Artifactual troughs and flickers in recorded stream depth #18689Just wondering if you could post a link to where the data is being collected, and look at it as a system.
Oh interesting, Thanks for sharing, Sounds like it connected some of the time, showing that it was possible to connect. I’ve found there are four source of failure – setup to cell tower, TCP/IP setup, POST ack, MMW timeout,
I found this hardware data sheet – but it turns out there is a GM1 and GM2 – GM1 is the low power. I wonder which one you got?. https://mm.digikey.com/Volume0/opasdata/d220001/medias/docus/6378/XB3-C-GM2-UT-001.pdf
SUPPLY VOLTAGE 3.3 – 4.3 VDC
AVG TRANSMIT CURRENT (LTE-M) 1.25 A peak, 410 mA average (GM2 modules), 450 mA peak, 200 mA average (GM1 modules)I was just wondering is the Mayfly 1.1 likely to handle the GM2 peak? though peaks are always a difficult number, as it should specify somewhere the capacitor (or pulse width) needed to handle that peak.
The XB3-C-A2-UT the data sheet .
SUPPLY VOLTAGE Standard Version: 3.3-4.3VDC;
PEAK TRANSMIT CURRENT Standard Version: 550mA;
AVG TRANSMIT CURRENT 235mAFor the low power (GM1) version of fw,
https://hub.digi.com/support/products/digi-xbee/digi-xbee-3-global-lte-mnb-iot/
and found this User Guide (I had to feed a few dragons tasty data on the way there) https://www.digi.com/resources/documentation/digidocs/PDFs/90002420.pdf
I have had this recent email for a survey on Digikey, (pasted below, hope it comes out ~ feel free to click on what you think)
~~~~~~~~~~~~~~~~~~~~~~~~~~~~~~~~~~~~~~~~~~~~~~~~~~~~~~~~
Thank you for taking the time to participate in this survey.
Ron Konezny
President & CEO
Digi
<table border=”0″ cellpadding=”0″ align=”center”>
<tbody>
<tr>
<td>
<div>What is your overall impression of Digi?</div></td>
</tr>
<tr>
<td>
<table border=”0″ width=”100%” cellspacing=”5″ cellpadding=”0″>
<tbody>
<tr>
<td>Very favorable</td>
</tr>
<tr>
<td>Somewhat favorable</td>
</tr>
<tr>
<td>Neither favorable nor unfavorable</td>
</tr>
<tr>
<td>Somewhat unfavorable</td>
</tr>
<tr>
<td>Very unfavorable</td>
</tr>
</tbody>
</table>
</td>
</tr>
</tbody>
</table>
-
AuthorPosts