Home › Forums › Monitor My Watershed › MMW not receiving data
- This topic has 14 replies, 7 voices, and was last updated 2021-05-18 at 11:33 AM by
 neilh20.
-
AuthorPosts
-
-
2021-05-06 at 7:45 AM #15482
For the past two days for about a 10 hour period, it appears that MMW is not receiving data. I thought it was just my stations, but I see that all stations network wide are losing connection around the same time and for the same duration. Is there currently on going work being done on the site?
-
2021-05-06 at 9:37 AM #15483
I believe this is the same issue that was reported here? If so, it should mostly be resolved. The browse sites feature is now working; the sparkline plots (panels) are not working but should be soon. Note that only data display was affected; Monitor My Watershed continued to collect the data. Here is the GitHub issue if you’d like more details.
-
2021-05-07 at 5:49 AM #15485
I am seeing what I think @thomas-schanandore is seeing as well.
MMW is saying that many sites have not been updated (ex. May 6, 2021, 3:50 p.m. (UTC-05:00) (12 hours, 55 minutes ago).Last night I could not manually upload my data and this morning I receive a Server Error (500) when trying to log in
-
2021-05-07 at 6:24 AM #15486
The database still has some issues with sparkline plots and a few other things. The team is still working on it but don’t have an estimate on when things will be back to 100% functional again.
-
2021-05-11 at 3:37 PM #15492
Hi All,
Just checking in to see if there is any news about the status of MMW. I haven’t been able to find relevant issues in the ODM2 Github site, so thought I’d share here what we’re seeing on MMW:
- The big Download Sensor Data button returns a Server Error (500).
- No sparkline plots are displayed.
- The 3 buttons for each variable are disabled: Open in TSA, Download, and View Table.
- Site Alerts are being sent out by MMW for all our sites, though the data is apparently getting uploaded.
- TSA won’t display charts beyond the morning of 5/1 UTC (e.g. Bear Creek).
Thanks,
Matt
Trout Unlimited
-
2021-05-11 at 3:41 PM #15493
Some features of MMW are still down due to some complex server issues. They’re still working on it but haven’t given a specific date when everything might return to normal.
-
2021-05-13 at 6:42 PM #15512
We are also seeing the data gaps that I believe @thomas-schanandore and @movingplaid have reported above across all 3 of the stations that I’ve checked.
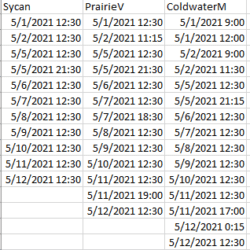
In particular, there are large gaps (9- to 24-hours) every day since at least May 5th, followed by data resuming at 12:30UTC across every station. This suggests that something is failing on the server and that an intervention is being done to fix/restart it every day sometime shortly before 12:30UTC.
I’m attaching a screenshot that shows the UTC timestamps marking the end of each data gap since May 1st for 3 of our stations, where the data gap is of duration greater than 1 hour.
Matt
Attachments:
-
2021-05-14 at 5:18 PM #15516
Hi All,
Our apologies for the several sets of bugs on the Monitor My Watershed / EnviroDIY / ODM2DataSharingPortal.
The short story is we have had 3 sets of issues in the last two weeks:
- Browse window not mapping sites or populating filter pane #496
- Fixed! No loss of data.
- Networking (Domain Name System) issues
- Fixed!
- Hours of data were unfortunately lost May 5-7, unfortunately.
- “Sparkline” plots and CSV downloads not functioning
- Ongoing
- No data are being lost. All data will “come back” when we fix it.
- The cause was related to #1 and maybe #2
- Issue is caused by a corrupted catalog crosswalk (similar to what happened previously with Data isn’t appearing in sparklines or TSA – but only for some parameters #436)
- We know how to do the short term bandaid fix, and it takes a good bit of processing resources/time and needs to be monitored. Unfortunately, we didn’t find a window this week to do it. We will prioritize it for early next week.
- The long term fix requires a big architectural overhaul, which we have mapped out but are seeking funding before we start. For an idea of what is required, see our Release 0.12 – Tech Debt updates and and Release 0.13 – Refactor code for performance & scalability Milestones.
Thank you for your patience with these issues. We’re very excited to overhaul the system and are getting closer to pulling together sufficient funds.
- Browse window not mapping sites or populating filter pane #496
-
2021-05-14 at 5:55 PM #15517
Thanks @aufdenkampe – really appreciate that update, and all of the hard work by you and the team to fix and document these issues!
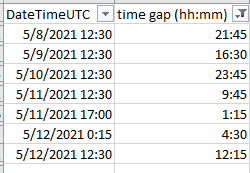
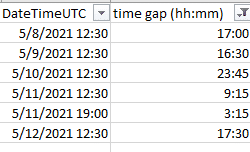
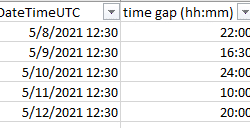
Note that the lost data appears to extend beyond May 7th, with very large data gaps each day from the 8th through 12th. The images attached below show these data gaps for 3 of our sites, with the UTC timestamp when datapoints resumed and the duration of each outage. I’m assuming these data are lost too.(?)
Matt
Attachments:
-
2021-05-15 at 2:24 PM #15525
I’ve been seeing gaps, lost data in downloaded .csv ~ hopefully comes back.
Checking this morning there has been no gaps as I can find from the downloaded .csv in my test site since
UTC 2021-05-12 11:45 or PDT 2021-05-12 3:45
-
2021-05-17 at 9:16 AM #15543
@mbarney & @neilh20, the CSV downloads are not an effective way of accessing data gaps, because that mechanism relies on the same corrupted catalog crosswalk that underlies the problem with the sparkline plots.
There are really only two ways for you to assess data gaps:
- Keep a record of server response codes from RESTful POST requests, from your device or from a program/script that uses a correctly formatted JSON payload with all the correct tokens.
- Fetch the data using WOFpy REST service (https://monitormywatershed.org/wofpy/), which currently only responds with one value, so you need a script that will integrate through all time intervals.
-
2021-05-17 at 10:04 AM #15544
OK, thanks for that clarification.
Matt
-
2021-05-17 at 2:06 PM #15545
Hello Anthony, yes thanks for the clarification.
As an engineer, I am often asked is the solution more painful than the problem it is solving!
The problem breakdown, when looking through the eyes of hydrologists ; a) is the remote sensors working?, b) is the delivered data to the web reliable? either visually or downloaded c) how to back-up all the costly data collected to a safe repository for a complete history. (TNC sensibly does this for its data collected)
In terms of the current situation with the “corrupted catalog crosswalk”,
when its working (a) it is possible to see that the remote sensor is working, and the date under the sparkline plots appears accurately to represent the latest record deposited.
(b) for me when the data is delivered it is reliable, though could be incomplete. I use the sample_number, and plot it to quickly visualize any data loss.
(c) for the backup it can be obtained through local Mayfly uSD via boot net. To be able to download a coherent .csv is definitely an advantage and is definitely valuable to be able to scrape it through an automated mechanism. I’ve found the wofpy interface complicated and has its own problems for the same type of variable.
Appreciate the work that is going on to fix it.
-
2021-05-17 at 4:44 PM #15546
Hi All,
Good news! We completed the fix to issue #3 “Sparkline” plots and CSV downloads not functioning.
As expected, most of the data that looked to be missing is now showing up in the “Sparkline” plots, in the data table views, and in the CSV downloads.
One disappointing discovery is that the #2 Networking (Domain Name System) issues lasted longer than we had thought. It looks like hours-long chunks of of data were lost from May 5 to May 12. You can see these gaps as straight lines here: https://monitormywatershed.org/tsa/?sitecode=WCC019&variablecode=Decagon_CTD-10_Depth&view=visualization&plot=true (zoom into May 3-15 to see).
If you really need this data, remember that it should be stored in CSV files on your device’s SD card. If you retrieve that data, you can upload it to the Monitor My Watershed web portal to fill in the blanks.
-
2021-05-18 at 11:33 AM #15548
faaaaantastic !!!
My data looks good from the May 12. Thankyou so much to everybody who has pulled that together.
-
-
AuthorPosts
- You must be logged in to reply to this topic.

 Welcome to EnviroDIY, a community for do-it-yourself environmental science and monitoring. EnviroDIY is part of


